1 三种日志
In this post, I am sharing the basic purpose of pg_log, pg_clog and pg_xlog log directories in PostgreSQL.
If you look into your PostgreSQL data directory, you can find a different type of log folders.
pg_log:
This is a default database logs like: error messages, executed query log, dead lock information, Postgers start/stop messages.
First, you should look into this folder for any investigation. Most of the time we are getting an error because of bad queries or wrong configuration so in these cases we can find the important log messages from this folder.
You can also delete unwanted or old log files because It stores only database action related messages which are not critical for PostgreSQL Server.
There are a few parameters in Postgres.conf file related to pg_log folder, you access below article for this.
pg_clog:
We cannot read log files of this folder because it is for PostgreSQL internals. It contains logs for transaction metadata. PostgreSQL server access this folder to take the decision like which transaction completed or which did not.
This is critical log folder, you should never forget this folder during your pg_data directory backup.
pg_xlog:
At all the times, PostgreSQL maintains a write-ahead log (WAL) in the pg_xlog/ subdirectory of the cluster’s data directory. The log records for every change made to the database’s data files. These log messages exists primarily for crash-safety purposes.
It contains the main binary transaction log data or binary log files. If you are planning for replication or Point in time Recovery, we can use this transaction log files.
We cannot delete this file. Otherwise, it causes a database corruption. The size of this folder would be greater than actual data so If you are dealing with massive database, 99% chance to face disk space related issues especially for the pg_xlog folder.
But don’t worry, There are multiple ways to optimize pg_xlog folder by removing old WAL files.
2 日志分析方案
pgbadger 是一个大牛基于perl语言写的日志分析脚本,2万行代码在一个脚本文件中,利用html+js+css来直接生成美观的日志分析报告,在浏览器便可查看。perl语言强大在于自带正则表达式,非常适合做文本分析。
需要明确的是,日志分析分析的是pg_log, 做流备份是关于pg_xlog的wal(write ahead log)。
问
Is it feasible to use pgbadgerwith ‘logging_collector‘ off?
How about using pgbadger to output log statistics once a week?
My disk with 255GB SSD to store satellite image with postgis, the disk can provide log space for the database for only one week.
答
YES, pgBadger is fully compatible with syslog output or stderr handle by system logging. Usually logging_collector is off by default on most distribution.
There is no problem of running pgbadger to report statistics once a week, the only limitation is the size of the log after one week. pgBadger is able to parse huge log file very quickly in multiprocess mode but some time it is better to generate reports each days. There is an incremental mode in pgBadger that combines the two reports. In this mode you can just execute pgbadger every day and it will automatically generate a cumulative report on weekly statistics. See -I | --incremental option for this mode. For example you can have a cron task running each nigth over your PostgreSQL log files:
0 5 * * * /usr/bin/pgbadger -I -q /var/log/postgresql/postgresql-11.log* -O /var/www/pg_reports/
it will automatically generates daily and weekly incremental reports.
By giving the full log file to parse each time (/var/log/postgresql/postgresql-11.log*) you don’t have to take care about log file that have already been parsed or those who have been renamed and compressed by logrotate. In this mode pgBadger will never parse a log twice, only new log or new part of the current log are parsed.
3 日志分析配置
分析方法
LOG file案例
LOG file sample in postgresql-10-main.log:
2019-02-17 15:13:43.546 CST [16761] 日志: checkpoint starting: time
2019-02-17 15:13:49.215 CST [16761] 日志: checkpoint complete: wrote 55 buffers (0.3%); 0 WAL file(s) added, 0 removed, 0 recycled; write=5.514 s, sync=0.054 s, total=5.669 s; sync files=2, longest=0.054 s, average=0.027 s; distance=154 kB, estimate=5613 kB
config配置修改
config file的修改部分:
- Where to Log -
log_destination = ‘stderr’
log_min_duration_statement = 30- What to Log -
log_checkpoints = on
log_connections = on
log_disconnections = on
log_error_verbosity = default # terse, default, or verbose messages
log_line_prefix = ‘%m [%p] %q%u@%d ‘
log_lock_waits = on # log lock waits >= deadlock_timeout
log_temp_files = 0 # log temporary files equal or larger
log_timezone = ‘PRC’- Process Title -
cluster_name = ‘10/main’
分析语句
the pgbadger cmd line:pgbadger -f stderr --prefix '%m [%p] %q%u@%d ' /var/log/postgresql/postgresql-10*
日志分析无内容问题
上述配置检测不到任何日志语句,怀疑是日志中的中文问题,查阅pgbadger文档发现确实不支持local语言。所以根据教程再次修改配置文件:lc_messages = 'C'
修改后需要使配置文件生效
config文件配置生效问题
失败:reload config file
SELECT pg_reload_conf();
reload后日志没有更新,没有生效
成功:restart service
重启服务
postgres@dorbodwolf-Precision-Tower-3620:/var/log/postgresql$ service postgresql status
● postgresql.service - PostgreSQL RDBMSLoaded: loaded (/lib/systemd/system/postgresql.service; enabled; vendor preset: enabled)Active: active (exited) since 五 2019-02-22 10:47:02 CST; 5s agoProcess: 6221 ExecStart=/bin/true (code=exited, status=0/SUCCESS)Main PID: 6221 (code=exited, status=0/SUCCESS)
查看日志文件修改日期
root@dorbodwolf-Precision-Tower-3620:/home/dorbodwolf/codes/perl/pgbadger_out_report# ls /var/log/postgresql/ -l
总用量 300-rw-r----- 1 postgres adm 8018 2月 22 10:47 postgresql-10-main.log-rw-r----- 1 postgres adm 26057 2月 17 07:35 postgresql-10-main.log.1
可以看到最新的postgresql-10-main.log在重启服务后立马更新,打开日志文件也可以看到按照配置参数格式生成了日志,下面截取的是部分行,最下面是最新的:
2019-02-22 10:47:01.122 CST [6210] postgres@postgres LOG: connection authorized: user=postgres database=postgres
2019-02-22 10:47:01.236 CST [6210] postgres@postgres LOG: duration: 23.422 ms statement:
SELECT d.datname as "Name",pg_catalog.pg_get_userbyid(d.datdba) as "Owner",pg_catalog.pg_encoding_to_char(d.encoding) as "Encoding",d.datcollate as "Collate",d.datctype as "Ctype",pg_catalog.array_to_string(d.datacl, E'\n') AS "Access privileges"FROM pg_catalog.pg_database dORDER BY 1;2019-02-22 10:52:00.204 CST [6194] LOG: checkpoint starting: time
2019-02-22 10:52:00.429 CST [6194] LOG: checkpoint complete: wrote 0 buffers (0.0%); 0 WAL file(s) added, 1 removed, 0 recycled; write=0.000 s, sync=0.000 s, total=0.225 s; sync files=0, longest=0.000 s, average=0.000 s; distance=0 kB, estimate=0 kB
尝试日志分析,发现成功了
root@dorbodwolf-Precision-Tower-3620:/home/dorbodwolf/codes/perl/pgbadger_out_report# pgbadger -f stderr --prefix '%m [%p] %q%u@%d ' /var/log/postgresql/postgresql-10-main.log
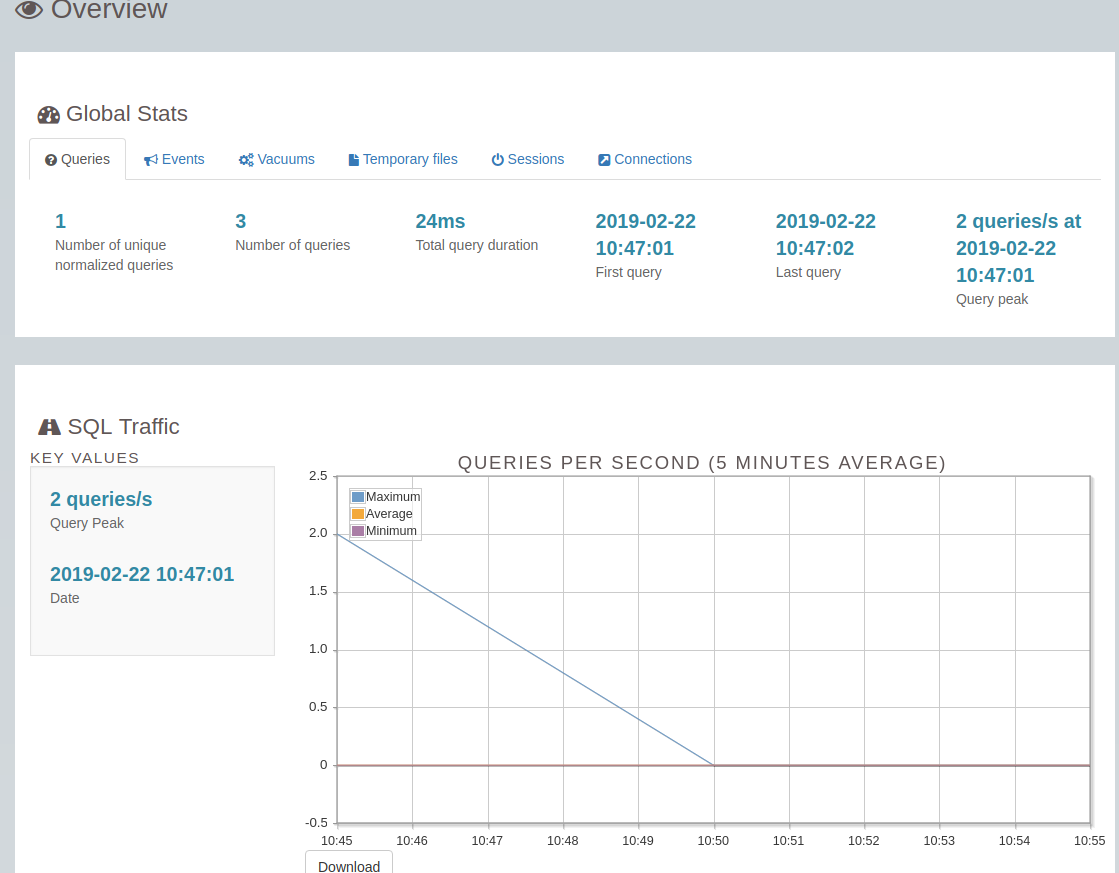
[========================>] Parsed 8899 bytes of 8899 (100.00%), queries: 3, events: 1LOG: Ok, generating html report...
截取日志报告的一部分:
接下来的事情就是定时任务跑去,搞搞流备份
